The usual disclaimer: I’m not investment advice. I hold $XBI. With thanks to Carl West for editing and feedback.
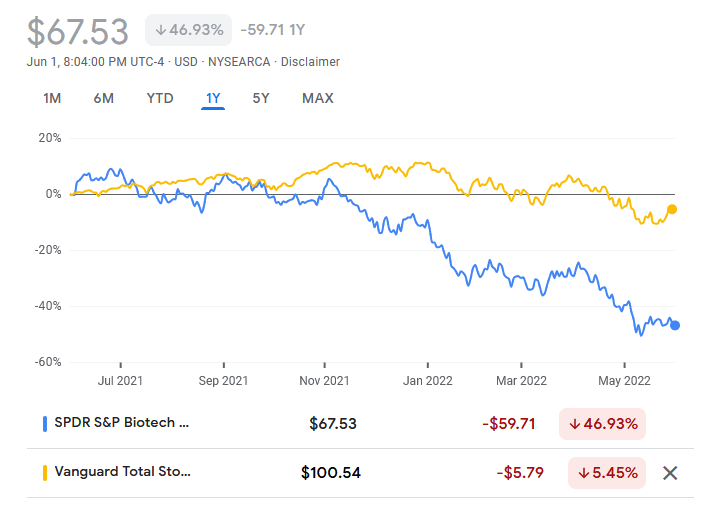
In case you don’t know, the biotech market is down. Like, really down.
With the biotech rout in the public markets, I wondered whether there are any trends that can be pulled out of the plunge in stock prices. I figured this would also be an interesting introduction to data from public markets; I’ve spent most of my time buried in individual SEC filings like 10Ks and haven’t worked with aggregate stock data. So let’s go ask some questions and get some data!
The Question
The commonly cited reason for biotech’s poor performance is that there are “too many preclinical companies” that are far from FDA approval and any revenue. But what do analysts mean when they say this? And are preclinical-stage companies actually the reason the biotech market is down so much?
Skip the next two sections and go to The Results if you want the punchline, but I will silently judge you.
The Data
Google search didn’t turn up any freely available list of all public biotech stocks, so I went with the list of companies published in the Q3 SPDR S&P Biotech ETF, better known as the biotech index fund $XBI. It contains 166 companies of the >700 small and mid-size biotech companies on the market, so upfront the data may be skewed. But $XBI is one of the most commonly-referred to biotech index funds in biotech industry news (particularly when proclaiming the fall of the biotech market), so I figured this would be a good place to start analysis.
I also hold $XBI stock (so, disclosure and all that) and it’s always good to understand more about what you’re investing in.
The Methods
I pulled the 166 companies in the $XBI into a spreadsheet and then manually analyzed each company’s website for therapeutic area keywords, number of preclinical-stage assets, number of clinical-stage assets, and number of approved assets. Some of these may be miscounted because of out-of-date pipeline information or my misinterpretation of the pipeline – many of these companies had an asset in multiple clinical trials for different diseases.
After pulling the disease area and pipeline data, I used Excel’s stock features to pull financial information for each company. This included the stock price on November 30, 2021 (near market high) and June 15, 2022 (near market low), market cap, and P/E (as applicable). While I used all companies in calculating the average drop in stock market, I excluded 13 companies because they no longer existed (e.g., Achillion Pharmaceuticals), or were diagnostic/medtech/lab tool companies whose pipelines were harder to evaluate (e.g., Myriad Genetics, MiMedx Group, Twist Biosciences). The average loss in stock price in the $XBI is 41% when including these companies, and 40% without them.
Finally, I checked company press releases for catalysts occurring on or before June 15, 2022 to identify what events may be driving some of the outliers.
The Results
(1) There aren’t simple indicators of the market
The stock price in $XBI declined an average of 41% in the ~6 months between November 30, 2021 and June 15, 2022. But none of the variables I looked at was a strong predictor of a company’s change in share price. Part of this may be edge cases of positive or negative news, but (unsurprisingly) there probably isn’t a single indicator of the market. This is good news, because it means the time spent digging into a company’s 10k and analyzing the individual markets for potential assets when deciding to invest isn’t wasted. That, or the market is just a mess moving on irrational hopes and fears.
So Analysts, you get to keep your jobs.

(2) Prices still move on the usual catalysts of acquisitions and clinical/regulatory events
For example, Turning Point Therapeutics (NASDAQ:TPTX) was up 96.8%. And a quick Google search reveals the reason: an acquisition announcement by BMS for $4.1 billion. There’s a similar story for Biohaven through its acquisition by Pfizer (NASDAQ:BHVN, up 29.2%), though that pathway was been a bit rockier.
Similarly, companies are trading based on clinical data readouts. Arcutis (NASDAQ:ARQT) was up 24% on positive Phase 3 data from roflumilast in sebhorreic dermatitis, which is already under consideration for approval in plaque psoriasis. On the opposite end, companies are hurting from negative data readouts; Praxis (NASDAQ:PRAX) was down 88.7% from a failed Phase 2/3 trial for major depressive disorder, and Akebia (NASDAQ:AKBA, down 87%) received a CRL from the FDA for vadadustat, their candidate for anemia in patients with chronic kidney disease.
(3) More clinical + approved assets = less loss in stock price…ish
I was curious to test the analyst refrain of “too many early-stage/preclinical companies on the market.” This could be interpreted in many ways: (A) too many companies who have only preclinical assets, (B) too many companies whose assets are mostly preclinical, or (C) too many companies that are too far from revenue (where “early-stage” just means “many years to approval and making some $”).
Let’s start with (A) too many companies whose assets are mostly preclinical. This doesn’t make a ton of sense, because there are a total of three (yes, three) companies on the XBI whose pipelines only have preclinical assets: Beam Therapeutics (NASDAQ:BEAM), Verve Therapeutics (NASDAQ:VERVE), and Sana Biotechnology (NASDAQ:SANA). This could still be true for biotech stocks not listed on the XBI, but three stocks aren’t pulling the entire XBI index down 41%!
So let’s look at (B) too many companies whose assets are mostly preclinical. To figure this out, I looked first at the proportion of the pipeline that was preclinical, which was calculated as:
[number of preclinical assets]/([number of preclinical assets]+[number of clinical assets]+[number of approved assets])
For example, if a company had 5 preclinical assets, 3 clinical assets, and 2 approved asset, that would be 5/(5+3+2) = 0.5.

Haha that coefficient of variation is pretty much useless.
But the resulting dataset doesn’t show much of a correlation. It was also hard to assess the number of preclinical assets; some small companies will have none because their sole asset has advanced into clinical trials, while some of large biotechs like AbbVie and Vertex have many preclinical assets because of their massive pipelines.
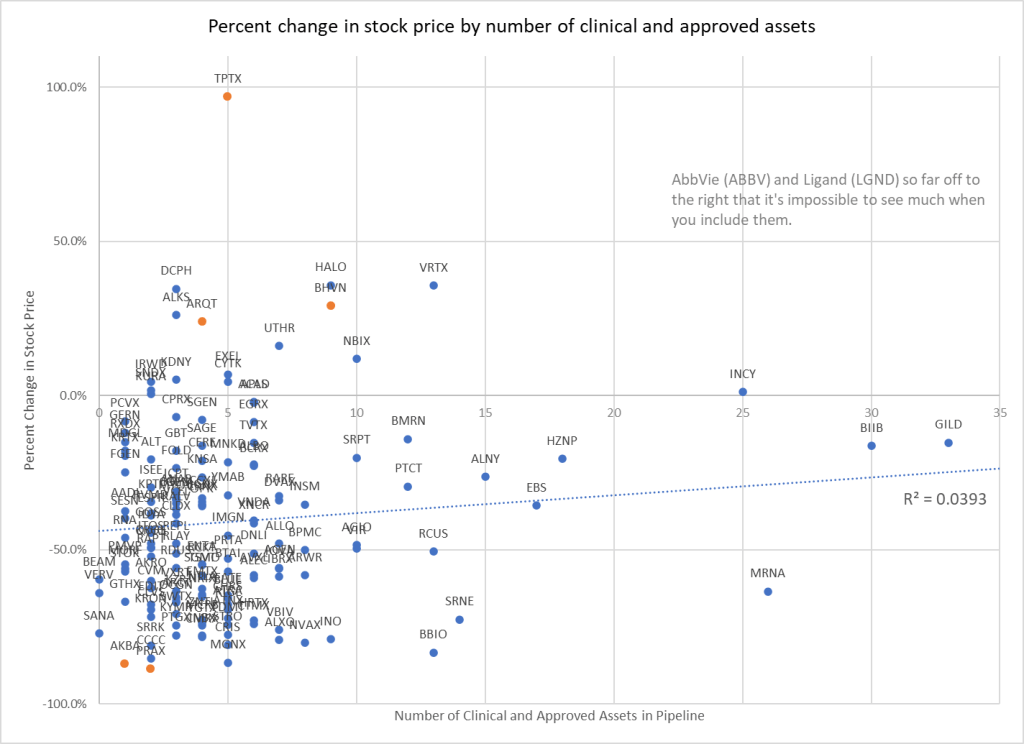
So next I looked at the inverse: the number of clinical-stage AND approved assets in a company’s pipeline. I included both clinical-stage and approved assets in the count because the move into clinical trials is a de-risking step that provides some value. And because the numbers were less variable, I could bin companies by their number of clinical-stage and approved assets (so, if a company has 3 clinical and 2 approved assets, that would be 5 total).
I then plotted their change in share price by the number of clinical-stage and approved assets, or number of approved assets they have. I was a lazy and stuck all the companies with >10 assets into one big bucket at the end, binned under ’11’ (come at me, stats profs).

Conclusion: stock market data is noisy AF.
A weak correlation appears when binning companies by number of clinical and approved assets, then plotting this number of clinical/approved assets by the percent change in stock price. The coefficient of determination isn’t anything crazy, but a modest 0.4006.
So then I tried something simple. What if the basis of investors change in stock price is just “how far have you gotten, ever?” We can do this by looking at the furthest stage a company has gotten to with any asset: Preclinical, Phase 1, Phase 2, Phase 3, or Approval. For simplicity, I binned Phase 1/2 and Phase 2/3 studies upward (so they joined Phase 2 or Phase 3 studies).

Error bars to make a PI scream.
There are still some gigantic variations in stock price (as illustrated by the standard deviation bars), but overall it lines up. If the furthest a company has taken an asset is Preclinical or Phase 1, it’s getting clobbered by the market (67% and 64% loss in value). The data get noisier following that, but there’s less loss in stock price for companies who have made it to Phase 2 or 3 (49% and 45% loss), and the least loss in price for companies who have made it to Approval (29% loss). So that suggests the driver behind loss in stock price is the earlier hypothesis (C): too many companies that are still too far from revenue.
One of the biggest criticisms/post-hoc analyses of the biotech rout has been that many companies IPO’d while still at the preclinical stage. Many of these companies would be in Preclinical, Phase 1, or possibly in Phase 2 studies at this point, which would mean they’re still years from revenue. The teams in companies without approved assets also remain ‘unvetted’ – it’s unclear they have what it takes to get an asset across the finish line.
Once a company has taken something through to approval, it has de-risked its team and ability to execute. More importantly, it is also close to the point of making actual sales-based revenue, which is the biotech company version of ‘winning’. And most of these companies are still years from the finish line.